What goes wrong
Every one of these began as a normal working day
Safety regulators across Europe, North America and Asia publish what happened when containment failed at the plants they oversee. Their records hold 67,465 accidents between them, in more than 50 countries, from 1944 to 2026. This is what is in them.
These are real accidents, recorded by the authorities that investigated them. Nothing on this page is a simulation, a product screenshot, or the experimental data we validate against. That evidence is a separate matter and lives on the Quality page.
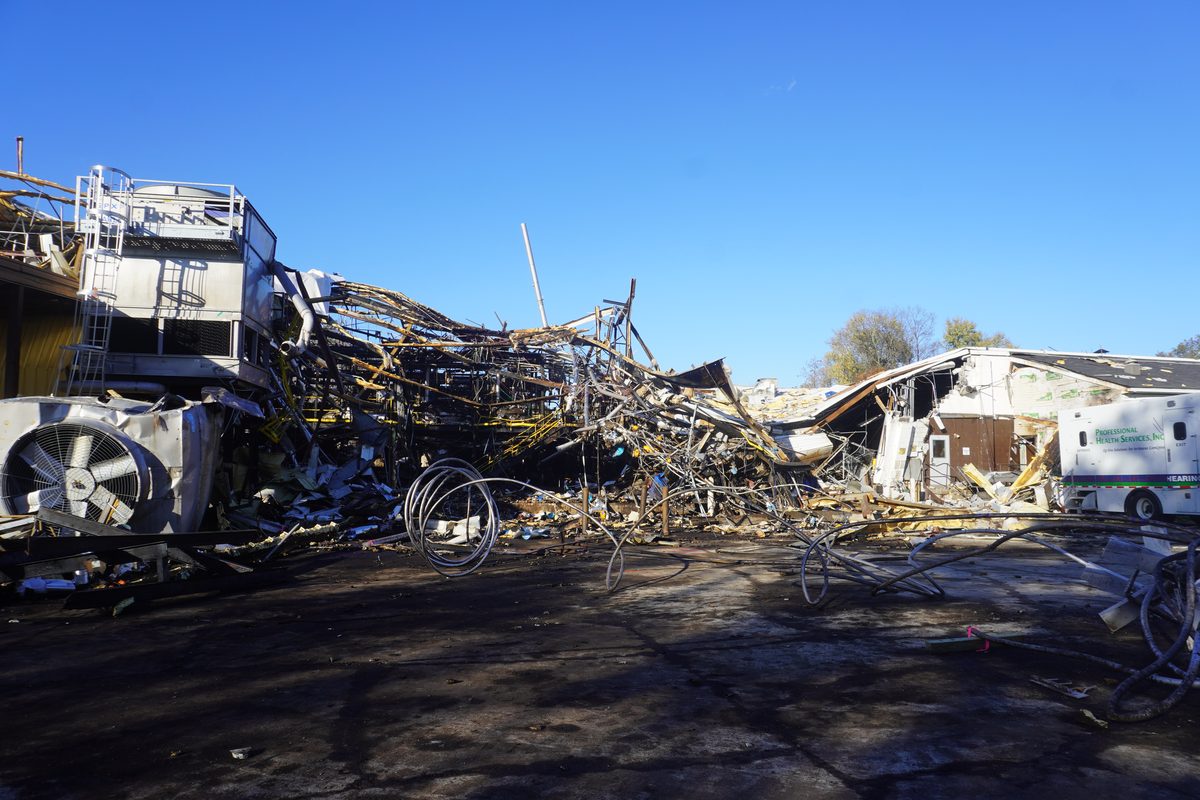
What an explosion leaves of a buildingUS Chemical Safety Board investigation 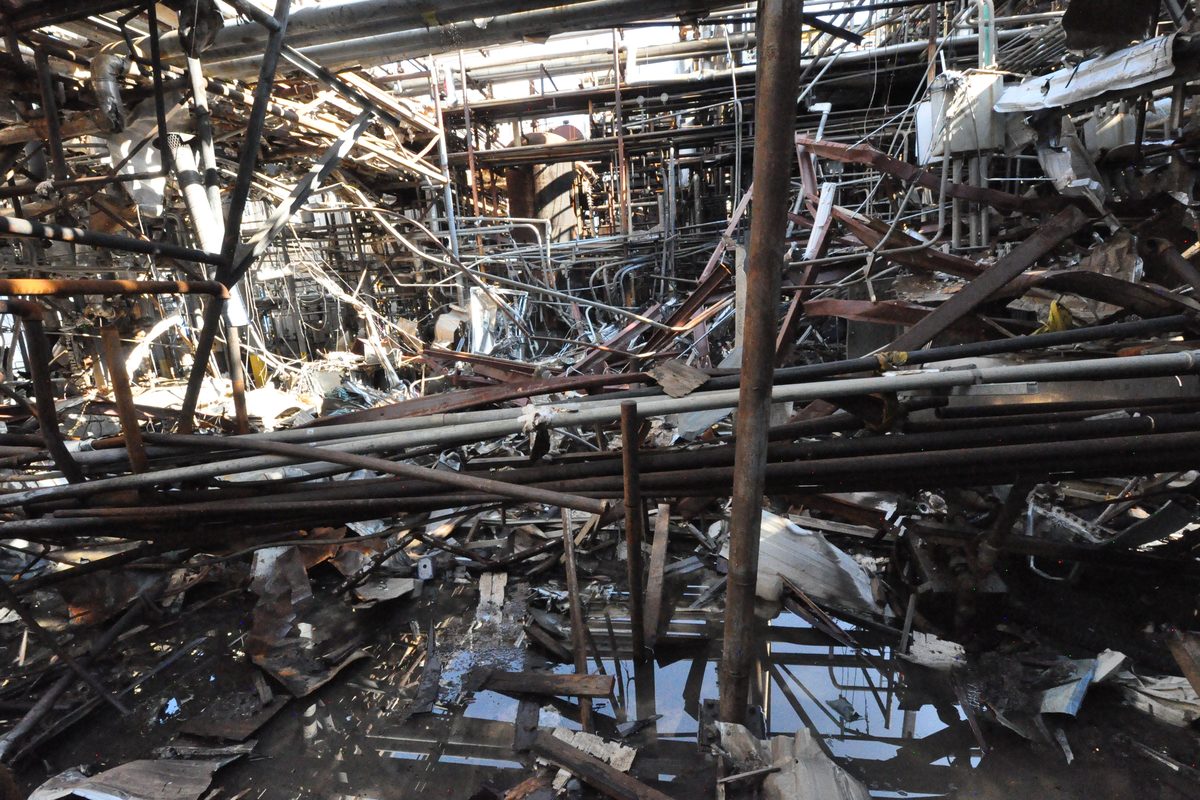
A process unit after a fire and explosionUS Chemical Safety Board investigation 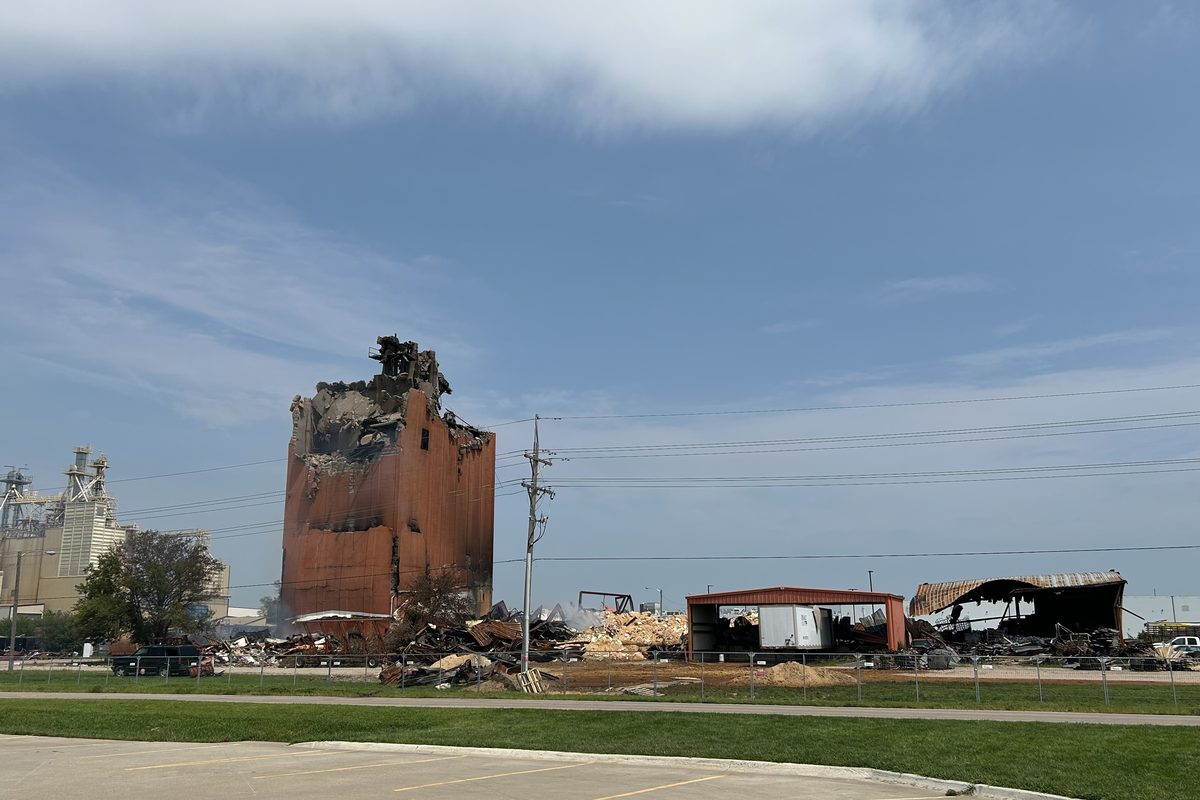
Storage, after the fire went through itUS Chemical Safety Board investigation 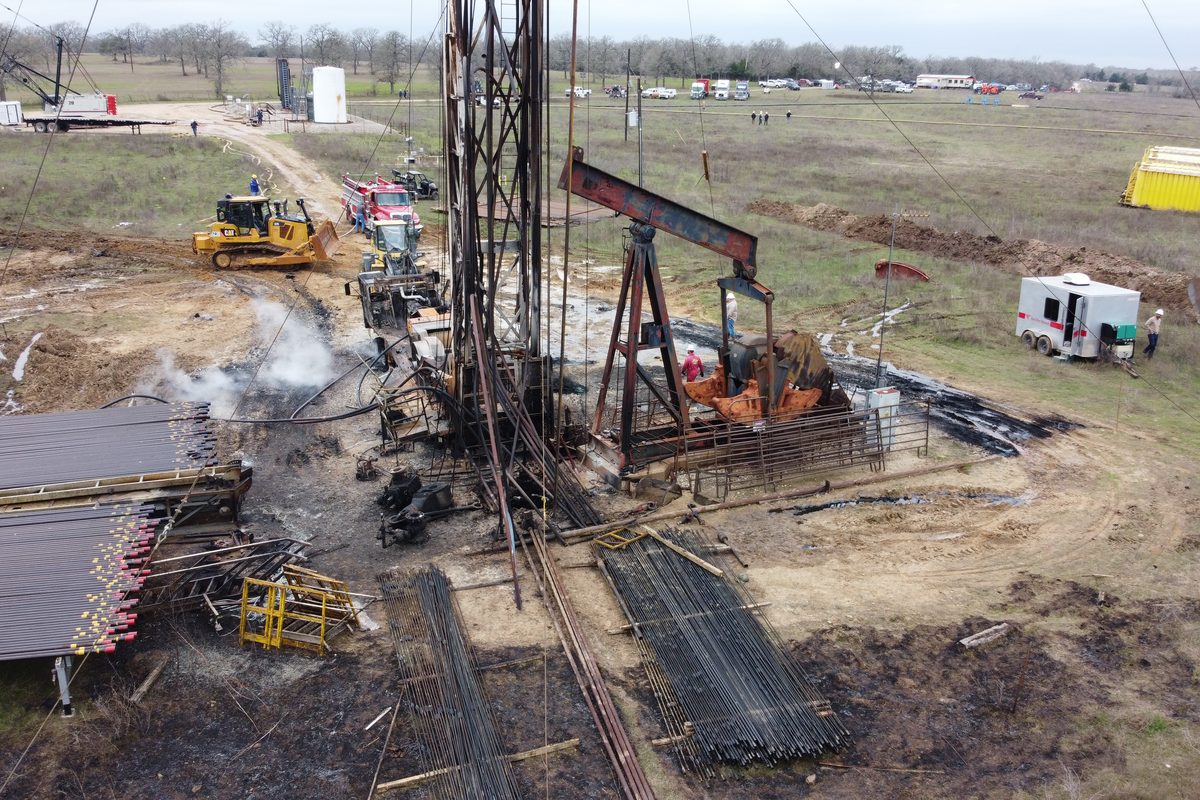
A wellhead site after a fatal explosionUS Chemical Safety Board investigation 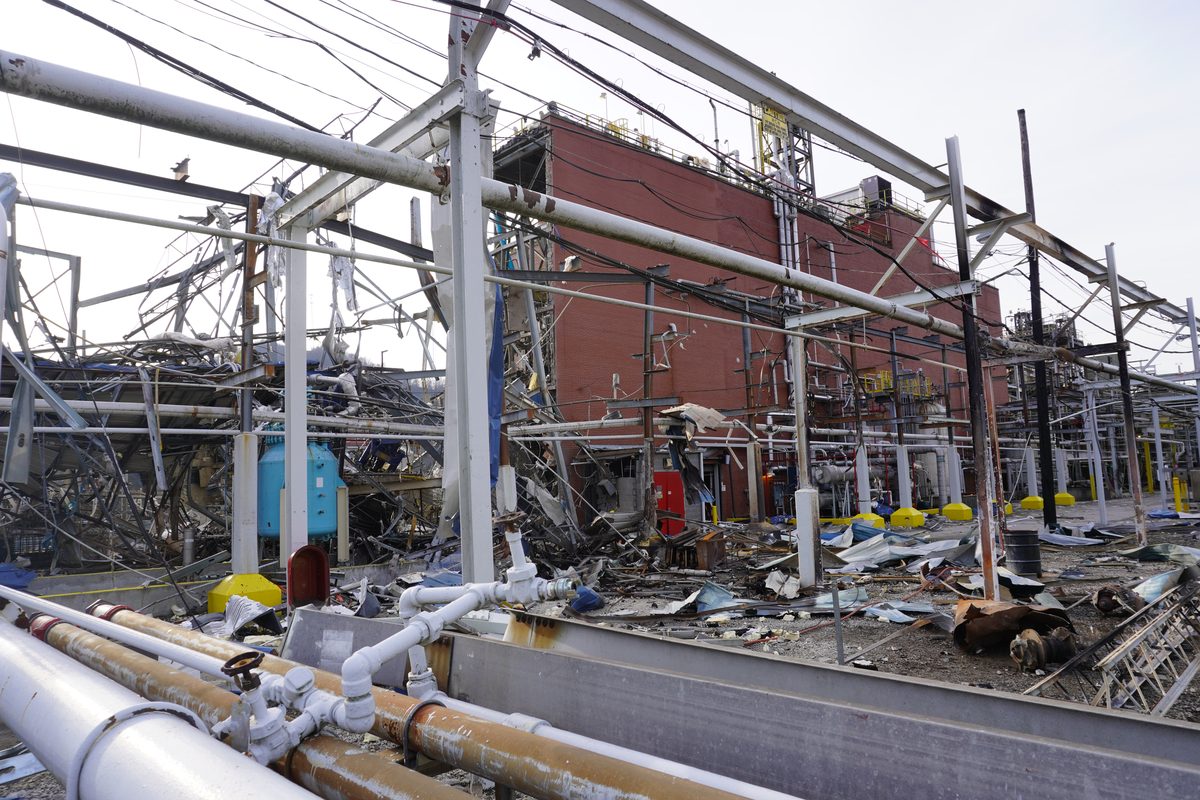
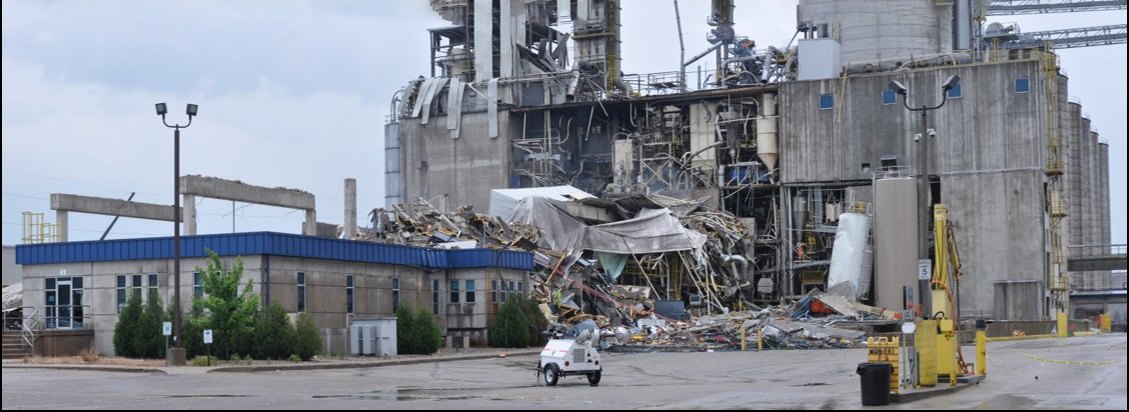
A building opened up by the explosion inside itUS Chemical Safety Board investigation 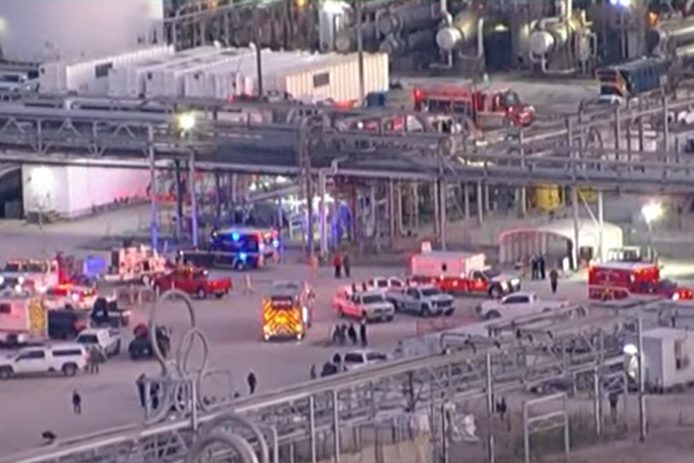
The response, once it has already happenedUS Chemical Safety Board investigation
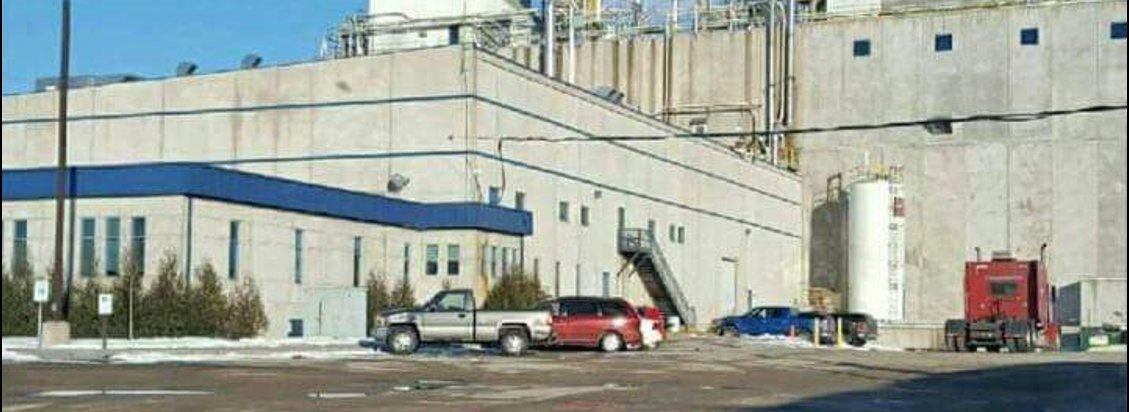
Photographs taken by the US Chemical Safety Board during its investigations, and in the public domain as the work of a federal agency. Every one is a real accident. None is a simulation.
The toll
What a loss of containment costs
6,712
people killed in the accidents sampled here
581
separate accidents killed at least one person
3,787
died in the worst of them, Bhopal, December 1984
81.8%
of all those deaths came from just twenty accidents
| Accident | When | Substance | What it became | Killed |
|---|---|---|---|---|
| BhopalIndia | 3 December 1984 | Methyl isocyanate | Toxic cloud | 3,787 |
| GAIL pipelineIndia | 27 June 2014 | Natural gas | Jet fire | 29 |
| Mumbai HighIndia, offshore | 27 July 2005 | Crude oil | Pool fire | 22 |
| LG PolymersVisakhapatnam, India | 7 May 2020 | Styrene | Toxic cloud | 13 |
| Indian Oil terminalJaipur, India | 29 October 2009 | Petrol | Vapour cloud explosion and pool fire | 12 |
| BuncefieldUnited Kingdom | 11 December 2005 | Petrol | Vapour cloud explosion and pool fire | 0 |
Buncefield killed nobody. It was among the largest peacetime explosions Europe has seen, it destroyed the terminal and damaged buildings for kilometres, and the fatality column reads zero. A consequence is not measured by its body count.
Almost all of the harm comes from almost none of the accidents. 4,660 of the 5,241 sampled killed nobody at all; the worst twenty hold 81.8% of the deaths.
A risk shaped like that cannot be managed on averages. Whether a site is safe is not settled by how often something goes wrong there. It is settled by how far it reaches on the day it does.
And the money
The same accidents destroyed the plant around the people
Nobody should need the second argument. But the budget for prevention is set by people who are not on site on the day, and it is worth saying plainly that the two losses arrive together.
US$1.6bn
of recorded damage, and that is a floor rather than a total
US$261m
from one gas release, the largest single figure in the archive
2 of 6
registers record a cost at all. The other four never ask
That 1.6 billion comes from the 1,368 accidents that carry a damage figure, all of them American, because the European and Indian registers do not collect one. It counts property. It does not count the production that stopped, the site that could not reopen, the remediation, the litigation, or a single uninsured loss.
The plant and the people are inside the same fence. The analysis that finds one finds the other.
What escapes, and what it becomes
The same release can end as a fire, an explosion or a toxic cloud
Which one happens is decided in the first seconds, by whether the cloud finds an ignition source and when. Same physics every time. A different answer on every site.
Read this per register rather than globally: each authority publishes a different range of outcomes, so the mix reflects six reporting scopes as well as the physics.
- Gas dispersion3,728
- Jet fire566
- Vapour cloud explosion483
- Pool fire295
- Toxic cloud160
- Flash fire6
- BLEVE2
- Dust explosion1
Show the numbersHide the numbers
| Consequence | Accidents |
|---|---|
| Gas dispersion | 3,728 |
| Jet fire | 566 |
| Vapour cloud explosion | 483 |
| Pool fire | 295 |
| Toxic cloud | 160 |
| Flash fire | 6 |
| BLEVE | 2 |
| Dust explosion | 1 |
And here is the problem
The record says what happened. It cannot say how far it reached.
Four things govern where a hazardous cloud travels: how much escaped, through what size opening, what the weather was doing, and whether it found an ignition source. Those are the four the record almost never has.
The date, the country, what it became and who it killed are recorded almost every time. The four that decide how far it reached are not.
11%
record how much escaped
2%
record the size of the opening it came out of
0.1%
record what ignited it
0.02%
record the weather at the time
Share of the 5,241 accidents sampled that carry a real value in that field. Counting actual measurements: a field filled in with the word “unknown” is not a record of anything.
So a hazard distance cannot be looked up. There is no table of past accidents to read it off, because they were never recorded in the terms the question is asked in. It has to be computed — from that plant’s inventory, that plant’s layout and that site’s weather, before anything goes wrong.
That is what consequence and risk modelling is for, and this is the plainest case for it we know: not an argument about software, just a count of which columns are empty.
Where this comes from
Six public registers
Figures are drawn from a balanced sample of 5,241 accidents, which caps the largest register so the picture is not simply a picture of one country, and keeps the severe cases whole. The damage column mixes two units at source, dollars from one register and millions from another, and is converted before it is summed. Nothing here claims any of these accidents would have been prevented by modelling, and near misses are absent from every one of these sources.
- ARIA / BARPI — Licence Ouverte 2.0
- PHMSA — US Government public domain
- eMARS — Public regulatory reporting data
- CSB — US Government public domain
- HSE — Open Government Licence v3.0
- Indian sources — Government of India open access
Contains public sector information licensed under the Open Government Licence v3.0. Archive assembled and analysed by Udhayaa K of SSN College of Engineering, Chennai, during an internship with AgniKawach in May and June 2026, mentored by Dr Deiveegan Muthusamy.